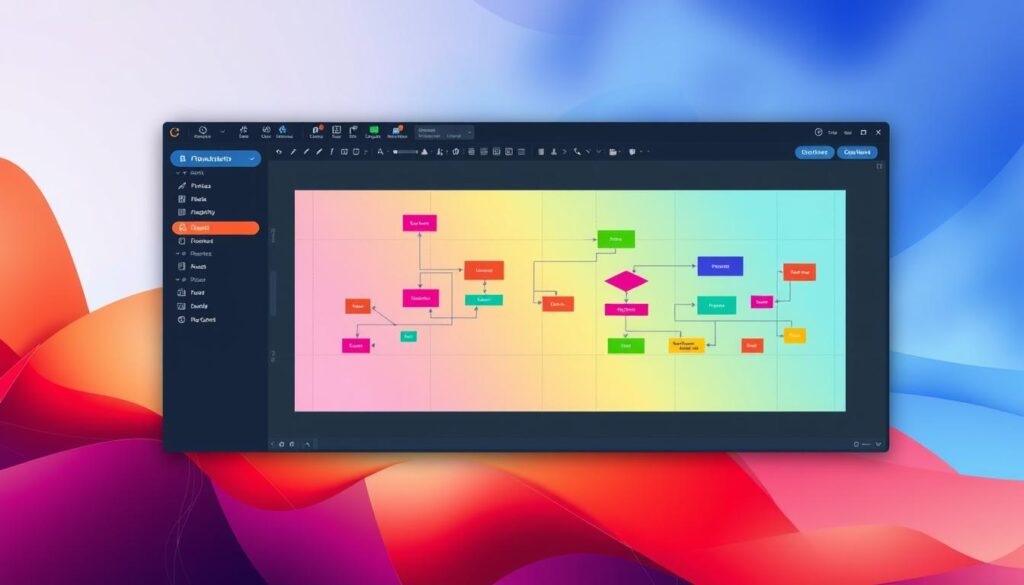
Flowcharts are great for showing how things work and making complex info simple. They are used in many fields, like software and manufacturing. They help teams see how tasks fit together.
Making good flowcharts is more than just drawing lines and shapes. It needs careful planning and the right symbols. With the right tools, you can make diagrams that help everyone understand and work better together.
In this guide, we’ll show you how to make flowcharts that look good and work well. We’ll talk about setting goals, choosing flowchart symbols, and making sure they’re the best they can be. Whether you’re starting out or want to get better, you’ll learn something new to improve your flowcharts. Keep reading to learn the essential steps of creating clear and effective flowcharts.
Understanding Flowcharts and Their Importance
Flowcharts are visual tools that change how we handle complex processes. Frank and Lillian Gilbreth first used them in the 1920s. Now, they are key in many fields, from computer programming to manufacturing.
Flowcharts are vital in project management, helping teams succeed. They make workflows clear, spot problems, and make operations smoother. For example, Agile teams use them to work better together and be more productive.
Flowcharts are not just for tech folks. People in education, sales, marketing, and engineering also use them. User flows in UX design use them to show how users will interact with products, making them easier to use.
Algorithm charting is a special kind of flowcharting for computer science. It helps programmers see the structure of their code before writing it. This makes coding faster and more accurate, thanks to pseudocode.
As businesses grow, flowcharts become even more important. They help describe procedures clearly, making them a must-have in our connected world.
Key Elements of Effective Flowcharts
Effective flowcharts use standard symbols to convey information clearly: rectangles for processes, diamonds for decisions, and arrows for direction. Consistent use of these shapes helps readers quickly understand the chart.
Clear, concise naming of each step enhances readability. Text inside shapes should be short (3-5 words), while longer descriptions should stay within 7-9 words for clarity.
Flowchart software, available in tools like Microsoft Office or specialized programs, ensures neat and consistent designs. While using colors can highlight different steps, limit the palette to four or five colors to avoid confusion.
Simplicity is key. Avoid overcrowding the chart with too many shapes or elements, and opt for a left-to-right flow for easier reading. Break overly complex charts into smaller sections to improve understanding.

Tools and Software for Creating Flowcharts
Creating flowcharts is now easier than ever with the many online flowchart makers available. These tools have user-friendly interfaces and templates to help you create diagrams quickly. Here are some popular options to suit different needs and budgets:
- Lucidchart: Offers a free plan for up to three documents, with paid plans starting at $9/month.
- Microsoft Visio: Available as both web and desktop versions, priced from $5 to $15 per user/month.
- Zapier Canvas: Free during its open beta phase, making it an excellent budget-friendly option.
- Miro: Known for its collaboration features, it provides free access to three boards, with paid plans starting at $8 per user/month.
- yEd: A completely free tool, that is ideal for basic flowcharting needs.
- EdrawMax: Starts at $15.90/month, offering a comprehensive diagramming solution.
- Moqups: Pricing begins at $17/month, focusing on prototyping and diagramming.
Step-by-Step Guide to Making a Flowchart
Creating a flowchart is a way to map out complex processes visually. Follow these steps for an effective flowchart:
- Define Your Purpose: Clearly outline what you aim to achieve, focusing on key details while avoiding unnecessary complexity.
- Identify Key Steps: List the main steps in your process, and gather input from your team to ensure accuracy and completeness.
- Draft a Layout: Create a rough draft to see how the steps fit together. This helps catch potential issues before finalizing.
- Use Standard Symbols:
- Rectangles for actions.
- Diamonds for decisions.
- Arrows to show process flow.
- Test and Refine: Seek feedback from users to identify areas for improvement and ensure the flowchart accurately reflects the workflow.
The best flowcharts are simple, scalable, and collaborative, ensuring they effectively communicate the process.
Best Practices for Designing Flowcharts
Creating effective flowcharts starts with a clear purpose. Keep your design simple and use standard symbols. This is key when using flowchart design software for workflow visualization.
Flowcharts should follow a left-to-right or top-to-bottom layout. This makes them easier to understand for most users. Use the right shapes for each step and keep symbols evenly spaced. These steps help make your flowchart clear and easy to follow.
Color can greatly enhance your flowchart. Use it to highlight important parts without being too much. About 45% of professionals find colors helpful in organizing different actions. This makes it easier to see the different steps and decisions.
Try to keep your flowchart on one page if you can. This makes it more user-friendly. If it’s too big, consider resizing or breaking it into smaller charts. Remember, simplicity is more important than complexity in workflow visualization.
Finally, double-check your flowchart. Look for consistency in design, correct symbol use, and logical flow. This ensures your flowchart clearly shows the intended process or workflow.

Customizing Your Flowcharts
Personalizing your flowcharts can make them more engaging and effective. Since 65% of people learn better through visuals, customized flowcharts help a lot.
Many templates offer a good start for visual process mapping, saving time and keeping projects consistent. Effective user flows for mobile apps can also benefit from these customized charts, making it easier to map out user interactions and interfaces.
Using brand colors and fonts is key in customization. It makes your flowcharts match your company’s look, creating a unified visual identity. Figma’s flowchart maker makes editing templates easy, helping teams work better together.
Think about the layout when customizing. Change margins, page orientation, and size to meet your needs. Excel users can use SmartArt graphics in the “Process” category for flowchart shapes. The Snap to Grid and Snap to Shape features help in resizing and aligning elements.
Don’t forget to use the right symbols for key steps. Rectangles, rhombuses, circles, and diamonds have their own roles in flowcharts. Connect these symbols well and customize design elements to make your visual process mapping clear and effective.
Troubleshooting Common Flowchart Issues
Creating flowcharts can be tricky. Many users face challenges when designing these visual tools. A survey shows that 60% of companies struggle with traditional flowchart creation due to complexity. Let’s explore some common issues and how to solve them.
- Confusing Elements: Inconsistent shapes, lines, or text can hinder clarity. Maintain a uniform style throughout your flowchart. Research shows that 65% of users find consistency essential for easy understanding.
- Illogical Flow: Ensure each step connects logically to the next by reviewing your flowchart step by step. 87% of employees prefer left-to-right layouts for readability.
- Lack of Clarity: Use color strategically to highlight steps and decisions. Studies indicate that 42% of designers find color useful for enhancing understanding.
Finally, seek feedback from your team to identify improvements. Their insights can help refine your flowchart, ensuring it communicates processes effectively.

Using Flowcharts in Team Settings
Flowcharts are great for teams, making complex processes clear. Online tools let teams work together in real-time. This makes it easy to create and improve workflows together.
Tools like Miro support teams well. They help ensure everyone agrees and understands the flowcharts. This way, teams can spot problems, make processes smoother, and work better together.
When using flowcharts, keep it simple. Use clear symbols, colors, and logical paths. Get input from experts to find areas to improve. Regular checks keep everything clear and accurate, helping manage workflows better.
The main aim is to make a visual guide everyone can understand. By using online tools and working together, teams can make their processes better. This boosts productivity and helps everyone understand complex workflows.

Integrating Flowcharts With Other Documentation
Flowcharts are great for showing how things work. When you mix them with other documents, they become even more useful. By combining flowcharts with written guides, you get a complete picture. This helps everyone learn in their own way.
Data flow diagrams are perfect for presentations. They make complex ideas simple to see. By linking flowcharts to guides or training, you build a strong info system. This way, everyone has all they need in one place.
Teams often use Confluence or Asana to manage projects. Adding flowcharts to these platforms makes them easy to find. This makes work smoother and more efficient. It’s important to keep your flowcharts looking the same. Use the same shapes, lines, and fonts to keep things clear and professional.
Using colors in data flow diagrams can really help. It makes it easier to tell different processes apart. When combining flowcharts, try to keep them simple and on one page. For bigger processes, break them into smaller charts. This keeps things clear and includes all the important details.
Exploring Real-World Examples of Flowcharts
Flowcharts have evolved since 1921. Now, they’re key in many fields for mapping and visualizing workflows. In software, they simplify complex coding into steps. This makes it easier for teams to spot errors and work more efficiently.
Manufacturing relies on flowcharts to outline production steps. This visual tool shows where things slow down. Managers can then fix these issues to boost productivity. Project managers also use them to define roles and tasks.
In business, flowcharts help with making tough decisions. They outline possible outcomes, guiding leaders. Marketing teams use them to improve the customer’s buying journey. These charts highlight areas for better customer satisfaction.
Healthcare uses flowcharts for patient care plans. This ensures quality care, no matter the shift or department. Teachers use them to organize lessons and explain complex ideas. Flowcharts make learning easier and more visual.
Advanced Flowchart Techniques
Flowcharts have come a long way since their inception in 1921. Advanced techniques like algorithm charting, data flow diagramming, and swimlane flowcharts now offer powerful ways to visualize complex processes:
- Algorithm Charting: Ideal for simplifying complex decision-making processes, making algorithms easier to understand and implement.
- Data Flow Diagramming: Focuses on how information moves through a system, helping identify bottlenecks and optimize data flow.
- Swimlane Flowcharts: Show task transitions across different teams or departments, clarifying responsibilities and improving operational efficiency.
The best technique depends on your specific goals, but leveraging these advanced methods can enhance clarity and streamline processes.
Wrap It Up: Mastering Flowcharts To Simplify and Succeed
Flowcharts are more than just visual aids — they’re your secret weapon for simplifying complexity and unlocking efficiency. By mastering the art of flowchart creation, you can transform abstract ideas into actionable plans, streamline processes, and improve team collaboration.
So, why wait? Dive into your next project armed with the power of flowcharts. Simplify, organize, and succeed! If you’re looking to level up your UX/UI skills or explore new design strategies, don’t miss our other articles on Mood Joy. It’s your one-stop resource for mastering the art of visual communication.
Start creating flowcharts that inspire action and drive results today!


