Flow charts are a powerful tool for visualizing processes, but creating an effective one requires understanding key rules and best practices. These rules ensure that your flow charts are visually clear and serve as efficient communication tools. They help simplify complex processes.
By following established guidelines, you can design flowcharts that are easy to understand and follow. These charts will also help you quickly identify problems and solutions.
Want to learn more about mastering flow chart design? Keep reading to discover expert tips and techniques that will take your flowchart skills to the next level!
Understanding Flow Charts: An Overview
Flow charts are visual tools that show how processes work. They are key in business process modeling, giving a clear view of task sequences. These diagrams help teams understand complex procedures, find bottlenecks, and better use resources.
The history of flow charts dates back to 1921 when industrial engineers Frank and Lillian Gilbreth introduced them. Their goal was to improve processes in various industries. Since then, flow charts have become essential for solving problems, making decisions, and optimizing workflows in many fields.
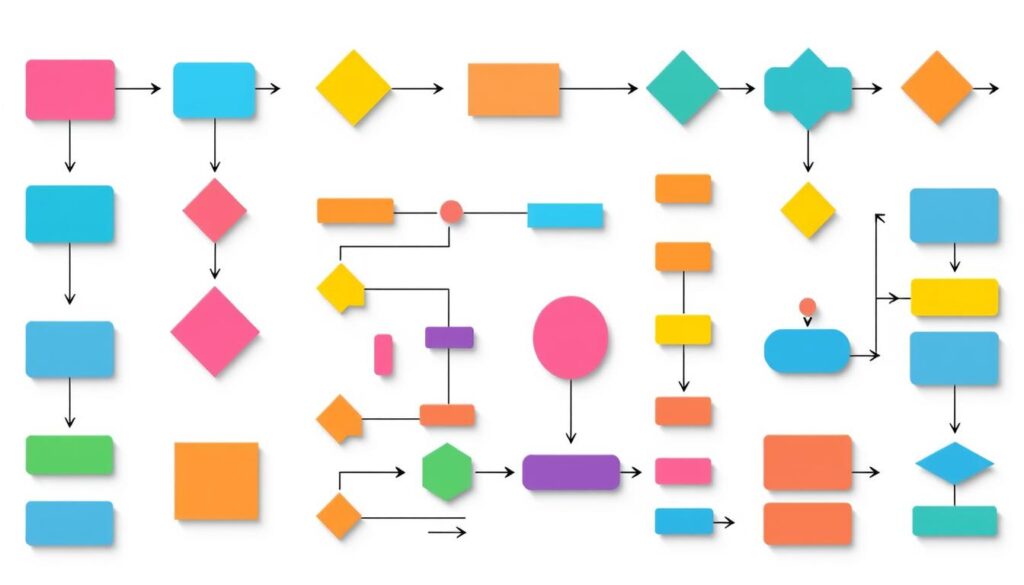
Flow charts have several important parts:
- Start/Stop symbols (terminals)
- Input/Output symbols (parallelograms)
- Process symbols (boxes)
- Decision symbols (diamonds)
- Connectors (circles or pentagons)
- Flow lines with arrows
Flow charts bring many benefits to business process modeling. However, flow charts have some limitations. Complex processes can be hard to show, and big diagrams need frequent updates. Still, the value of flow charts in visualizing and improving business processes is clear.

Key Components of a Flow Chart
Flowchart symbols are fundamental for clear process visualization. The four basic symbols are essential for effective design:
- Oval: Marks the start or end of a process.
- Rectangle: Represents tasks or activities.
- Diamond: Indicates decision points.
- Arrows: Show the direction of flow.
Intermediate symbols add more detail to your flowcharts. These include:
- Document symbols for paperwork steps
- Data symbols for information processing
- Input/output symbols for system interactions
- Merge symbols for combining processes
For more complex workflows, use on-page and off-page connectors. They link different parts of your flowchart, especially in multi-page diagrams. Always keep your arrow styles the same for better reading.
Tools like Gliffy make creating professional flowcharts easy. They have many symbols and templates to start with. As you get better, try specialized formats like BPMN symbols or process flow diagrams for certain industries or needs.
Establishing Clear Objectives
Creating an effective flowchart begins with clear goals, which are crucial for the entire process. A clear purpose guides your choices in complexity, terminology, and design.
When setting objectives for your flowchart, keep these points in mind:
- Identify the main purpose (process improvement, training, or documentation)
- Define your target audience (management, staff, or clients)
- Determine the required level of detail
- Decide on the appropriate diagramming conventions
Research shows that 30% of flowchart design tips focus on simplifying data perception and ensuring clarity. This highlights the need to tailor your flowchart to its intended use and audience. For example, senior management might need a high-level overview, while staff members may require a more detailed, task-level chart.
By setting clear objectives early, you lay the groundwork for a flowchart that effectively communicates your process. This ensures your flowchart meets its purpose, whether it’s improving business processes, enhancing regulatory compliance, or facilitating employee training.
Steps To Create an Effective Flow Chart
Creating process flowcharts is a valuable skill for visual process mapping. Follow these seven steps to craft an effective flowchart:
- Brainstorm all steps in the process
- Organize information logically
- Identify decision points
- Draft the flowchart with a clear starting point
- Use consistent symbols
- Ensure all decision paths are resolved
- Review and refine the flow
Keep the flow logical, typically moving from top left to bottom right in English. This approach aligns with natural reading habits, making your flowchart easier to follow. Remember, simplicity is key in flowchart design. Use 3-5 words per shape and limit sentences to 7-9 words for better readability.
By following these steps, you’ll create clear and effective process flowcharts. They enhance understanding and optimize workflows across various industries and disciplines.
Maintaining Simplicity in Design
Simplicity is crucial for effective flowchart design. Clear and concise diagrams help users quickly grasp complex processes. Focus on the essentials and eliminate unnecessary elements to ensure a seamless user experience.
Key Practices for Simple and Clear Flowcharts:
- Use concise labels: Limit text to a few words per step for clarity.
- Stick to one page: If the flowchart is large, divide it into linked smaller charts.
- Apply consistent symbols: Use standard shapes uniformly throughout the diagram.
- Maintain uniformity: Keep symbol sizes, fonts, and spacing consistent.
Simplicity doesn’t mean compromising functionality. By emphasizing clarity and readability, your flowcharts become more effective tools for communication and analysis. They become valuable across a wide range of industries and disciplines.

Color Coding: Best Practices
Color coding is a powerful tool in flowchart design, enhancing readability and comprehension. A good color scheme can show important steps, different types of processes, and what’s most important.
Best Practices for Effective Color Coding:
- Use three to four colors to keep the design simple and focused.
- Assign distinct colors to decision points for clarity.
- Use similar colors for tasks handled by the same team or department.
- Apply bold colors to draw attention to high-priority areas.
- Use varying shades to represent states like “pending,” “in progress,” or “completed.”
- Provide a clear key explaining the meaning of each color.
By following these tips, your flowcharts will be both beautiful and useful. They’ll help guide the viewer’s eye and highlight key parts of the process. This makes understanding and making decisions easier.
Fonts and Text Usage in Flow Charts
Choosing the right fonts is key in flowchart design. Sans-serif fonts like Roboto, Lato, and Open Sans are Choosing the right fonts is key in flowchart design. Sans-serif fonts like Roboto, Lato, and Open Sans are popular. They are easy to read. The Economist uses Econ Sans, and Bloomberg prefers Neue Haas Grotesk. These fonts stay clear even when enlarged, perfect for documenting processes.
Text in flowcharts should be short and to the point. Use short phrases or keywords instead of long sentences. This makes your flowcharts clear and fits the 10-20-second attention span. Make sure the font size is at least 16pt for easy reading on different devices.
Consistency is important in flowchart design. Use no more than three font styles and sizes. Use bold fonts only for titles or to highlight important words. Regular or medium weights are best for longer text.
- Update your flowcharts regularly based on user feedback
- Use verb-noun phrases for process steps (e.g., “Submit report”)
- Avoid technical jargon unless your audience is familiar with it
- Consider offering a PDF version for users who prefer printable flowcharts
Reviewing and Revising Your Flow Chart
Creating effective process flowcharts and workflow diagrams needs careful review and revision. After making your first chart, step back and look at it closely. Check for any mistakes in symbol use, too complicated flows, or unclear choices. Make sure all paths are clear and end in a clear spot.
Getting feedback from the people involved and those who will use the chart is key. Ask someone who doesn’t know the process to follow your chart. Their feedback can show you where to make things clearer or simpler. Clear process documents help keep employees happy and reduce job searching.
When you’re updating your flowchart, focus on:
- Simplifying complex sections
- Clarifying unclear steps
- Using symbols consistently
- Ensuring all paths have clear outcomes
- Checking if it’s easy to read and follow
Regular reviews keep your workflow diagrams current as processes change. Keeping your flowcharts up-to-date boosts productivity, teamwork, and cuts out unnecessary steps in your business.
Tools and Software for Flow Chart Creation
Creating effective flowcharts needs the right tools. Popular software like Microsoft Visio, Lucidchart, and SmartDraw have great features. They offer lots of symbols, automated drawing, and team work options.
When picking a tool for business process modeling, think about what makes your work easier. Look for software with:
- Customizable templates
- Drag-and-drop functionality
- Real-time collaboration
- Export options
- Integration with other business software
Cloud-based solutions like Lucidchart are great for team projects. They let many users work on the same diagram at the same time, no matter where they are. This boosts teamwork in making flowcharts.
Many tools also have AI to help make flowcharts better. These features can highlight important info visually, helping to spot areas needing attention in complex business processes.
Remember, the best tool is easy to use but still looks professional. Pick software that fits your team’s skills and project needs. This way, you’ll make clear, effective flowcharts.
Adapting Flow Charts for Different Mediums
Flow charts are great for showing how things work. They come in many types, each for a specific use. From simple flowcharts to swimlane diagrams, they help make operations smoother in many fields. It’s important to think about where others will view your flowcharts.
Digital flowcharts have cool features like links and expandable parts. They’re perfect for complex processes that need a close look. Print versions, however, must be easy to read on paper. Make sure all text is clear, and that the colors work well in black and white.
For presentations, it’s best to use simple charts for a quick overview. You can then show more detailed charts for deeper talks. Adding animations or step-by-step guides can help explain complex processes clearly. Qflow Cloud is a web-based tool for modeling business processes and integrating workflows.
The secret to good flow charts is making them flexible. Whether for simple tasks or complex systems, adjust your approach to fit your audience and the medium. This way, your flowcharts remain effective tools for sharing information on any platform.
Examples of Effective Flow Charts
Process flowcharts are great for showing complex workflows in many fields. They make it easy to understand complex steps in sales, project management, and more. Let’s look at some examples that demonstrate how businesses use flowcharts.
In healthcare, flowcharts make patient care easier and more consistent. For example, a hospital’s emergency room uses them to sort patients quickly. This helps staff respond fast to different patient needs, improving care.
The tech world also uses flowcharts a lot. Software developers use them to plan and fix code. A flowchart for user login shows the steps from start to finish. This helps in designing complex systems and finding problems.
In manufacturing, swimlane flowcharts help plan production. They show who does what in each step of making a product. This lets managers find and fix slow spots, making production better.
Conclusion: Unlock the Power of Flow Charts for Clearer, Smarter Design
Adhering to flow chart rules ensures clarity, consistency, and effectiveness in visual communication. By using standard shapes, clear labels, and logical connections, flow charts become powerful tools for simplifying processes and improving understanding. They also support better decision-making across various fields.
Want to take your UX/UI design skills to the next level? At Mood Joy, I dive deep into the principles and best practices that shape exceptional user experiences.
From mastering flow chart rules to optimizing wireframes and crafting intuitive interfaces, our expert insights and practical tips will guide you. They will support you through every step of the design process.
Explore my latest articles and discover how to create designs that truly resonate with users. Your journey to better design starts here!


